Configure Metrics
Pomerium Enterprise uses Prometheus as a metrics collection back-end. You can configure Pomerium and the Console to talk to an existing Prometheus server, or configure the embedded Prometheus backend. This guide assumes you're running both Pomerium and Pomerium Enterprise on localhost 127.0.0.1.
For production deployments, we suggest using a dedicated Prometheus instance.
Prepare Pomerium
In the Pomerium
pomerium-config.yaml, define themetrics_addresskey to a network interface and/or port. For example:pomerium-config.yamlmetrics_address: 127.0.0.1:9091The example above has Pomerium providing metrics at port
9999on an IP address reachable by the Pomerium Console service.If you're running Pomerium Enterprise in a distributed environment where the IP address is not known at the time of deployment, you can use the resolvable FQDN of the Pomerium host (
pomerium0.internal.example.com, for example), or override this key with the environment variableMETRICS_ADDRESS. We do not recommend exposing this endpoint to public traffic as it can contain potentially sensitive information.In the Pomerium Enterprise
pomerium-enterprise-config.yaml, define themetrics_addrkey to a network interface and/or port. For example:config.yamlmetrics_addr: 127.0.0.1:9092
External Prometheus
Add the listener to your Prometheus configuration, usually via
prometheus.yml:- job_name: 'Pomerium'
scrape_interval: 30s
scrape_timeout: 5s
static_configs:
- targets: ['127.0.0.1:9901']
- job_name: 'Pomerium Enterprise'
scrape_interval: 30s
scrape_timeout: 5s
static_configs:
- targets: ['127.0.0.1:9902']Reload the Prometheus configuration:
curl -i -XPOST path.to.prometheus:port/-/reloadIn the Pomerium Enterprise
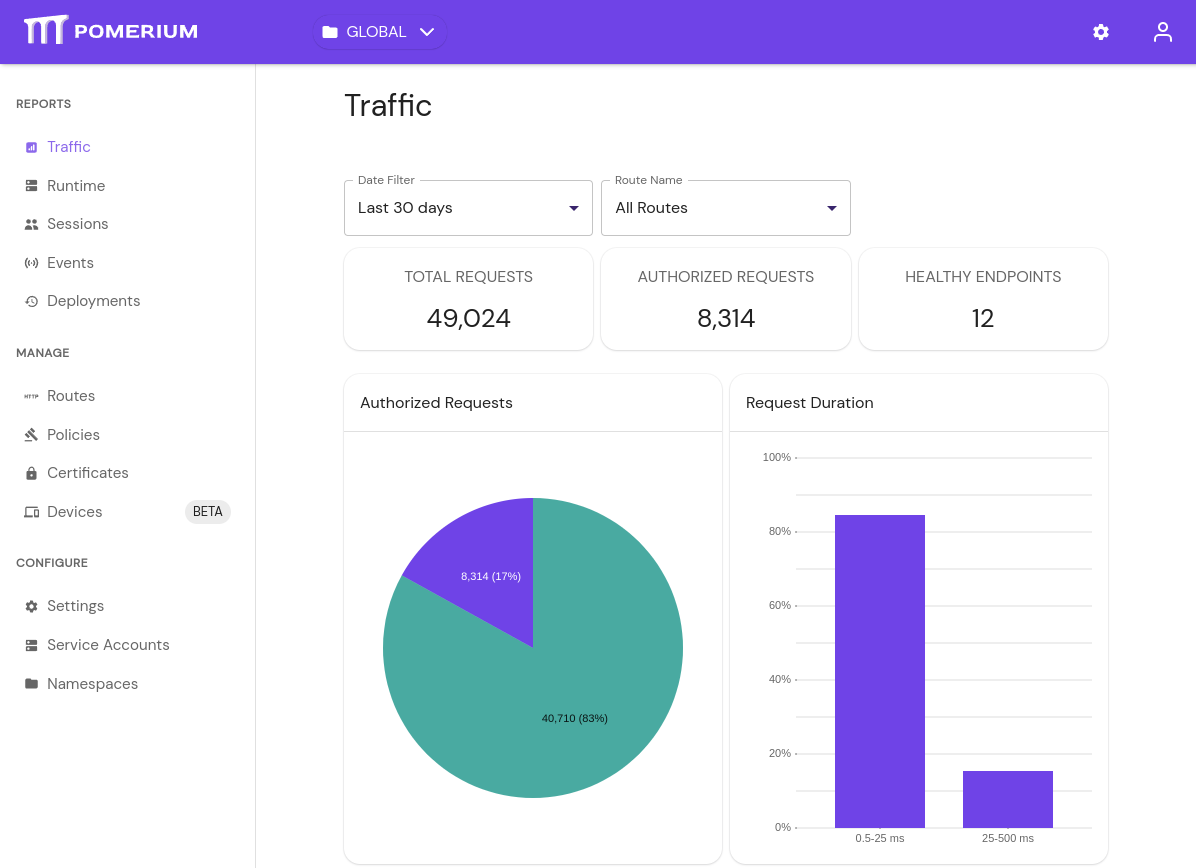
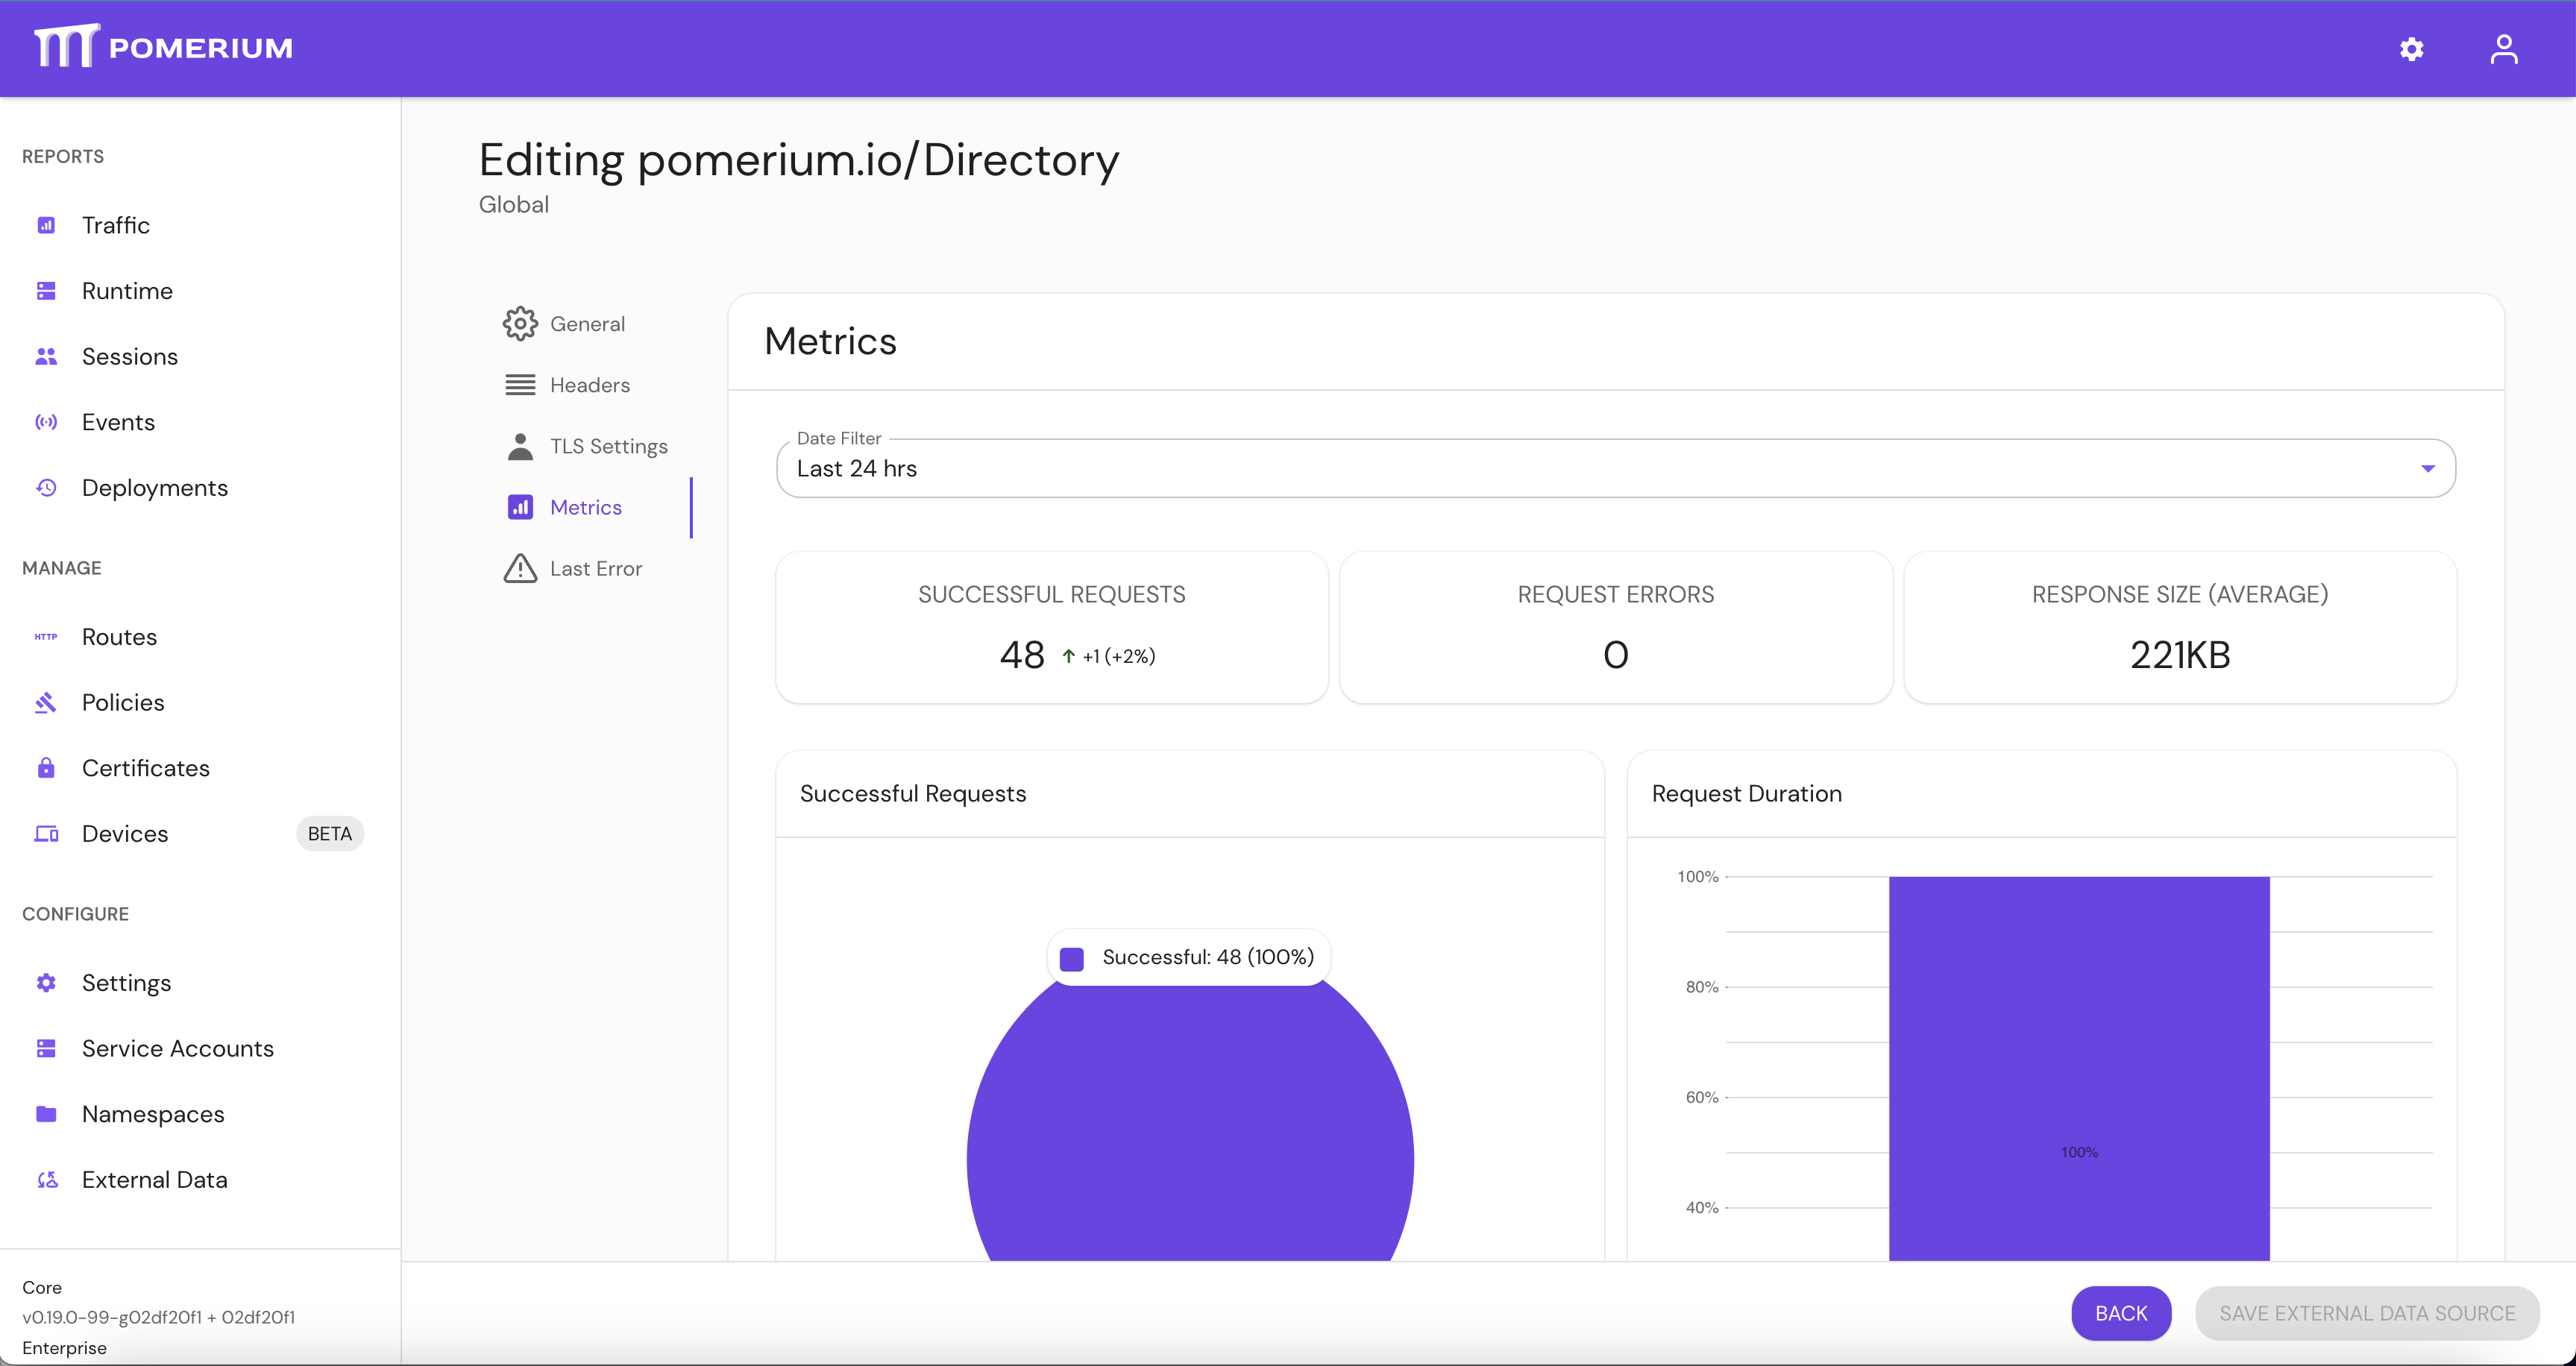
config.yamlfile, define theprometheus_urlkey to point to your Prometheus instance(s):prometheus_url: http://192.168.122.50:9090Restart the Pomerium and Pomerium Enterprise services. You should now see route traffic and External Data Source monitoring data in the Enterprise Console:


Embedded Prometheus
To take advantage of Prometheus embedded in Pomerium Enterprise, edit Pomerium Console's config file:
prometheus_data_dir: /var/lib/pomerium-console/tsdb
The directory path can be any location that the pomerium system user can write to. The example above uses the default location created by the OS packages.